Draw tree diagrams
Tree diagrams are used to represent multi-step experiments because they show the individual steps and outcomes well.
The probabilities can usually be determined relatively easily using the path rules.
With replacement
When replacing, the probabilities do not change.
Example
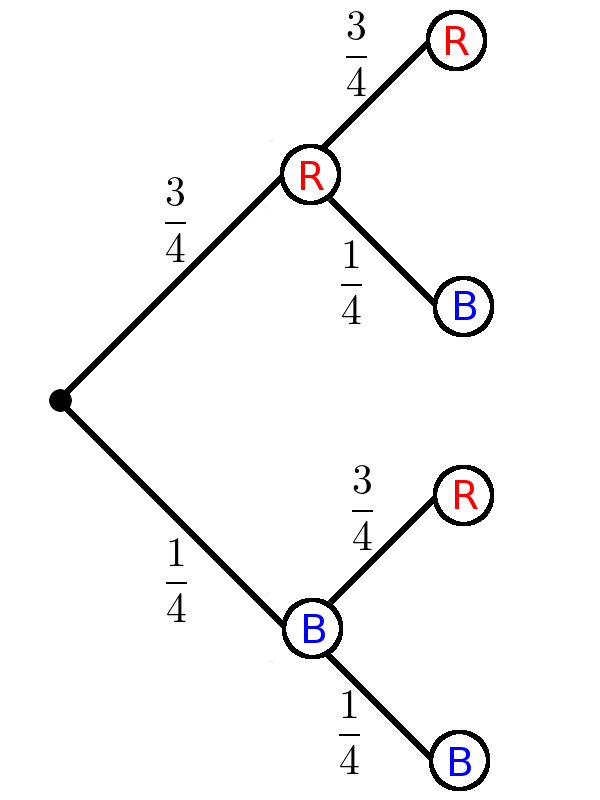
There are 3 red and 1 blue ball in an urn. Two balls are drawn one after the other with replacement.
Draw a tree diagram.
Draw 1st step
First, the first time drag is shown in the 1st step of the tree diagram.
Draw in the two options: red ball ("R") or blue ball ("B").Draw 2nd step
The second move is shown accordingly in the 2nd step.
The new options must now be entered here for each option of the 1st stage. After the first draw, a red or blue ball can be drawn again.Determine probabilities
Now the probabilities have to be entered for each draw.
It is important to pay attention to whether the probabilities change. This is not the case here, since you put the ball back.
3 out of 4 balls are red, so the probability of drawing a red ball is 3/4 and for a blue ball (1 out of 4) 1/4.
Without replacement
If you have an experiment without replacement, the probabilities change.
Example
There are 3 red and 2 blue balls in an urn. Two balls are drawn in succession without replacement.
Draw a tree diagram.
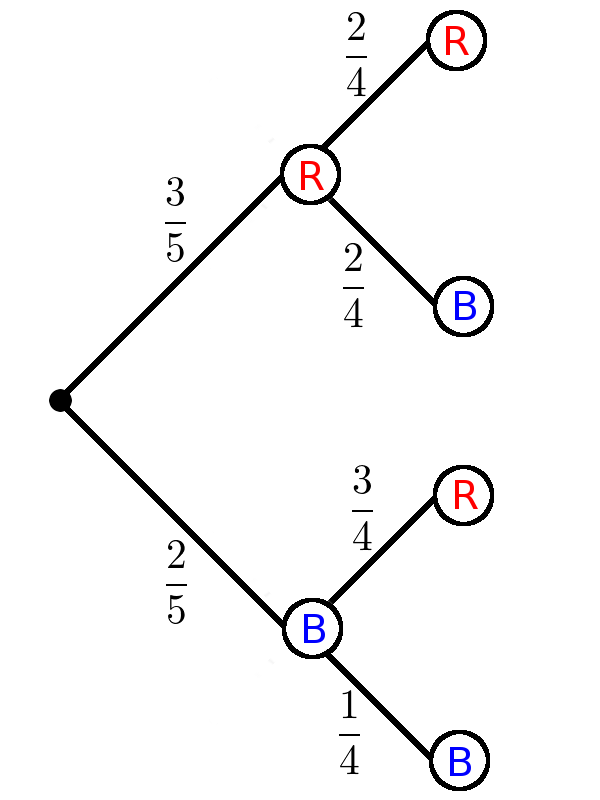
The total number of balls becomes one less and the drawn ball disappears. This changes all probabilities.