Graphical method
In the graphical method one imagines the linear equations as a linear function.
!
Remember
A system of linear equations can have different solutions, which can be found graphically as follows:
- one solution: the straight lines intersect at one point
- no solution: the straight lines are parallel to each other
- infinitely many solution: the straight lines are identical
i
Method
- Convert the equations appropriately.
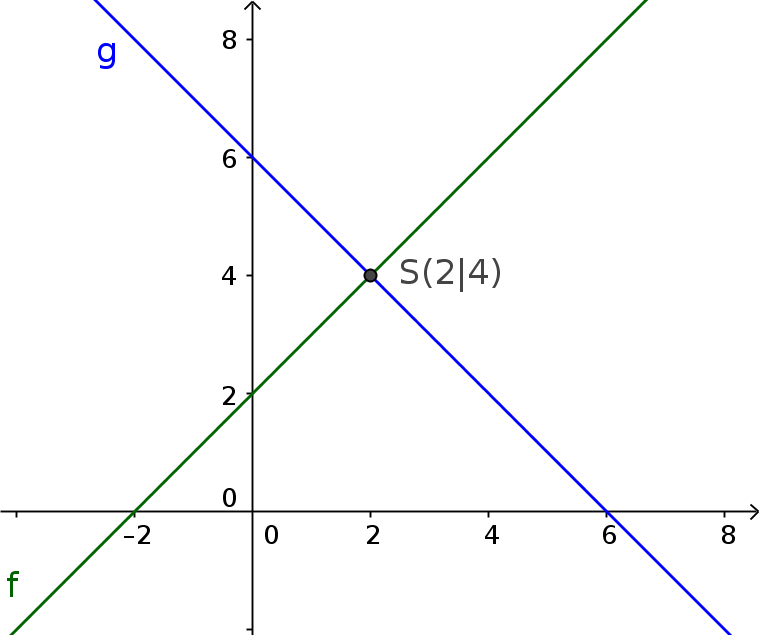
- Draw the graphs of the equations into a coordinate system.
- Read off intersection.
Example
Determine graphically the solution set of the system of linear equations:
- $4x=4y-8$
- $y-6=-x$
-
Convert the equations appropriately
$4x=4y-8$ $|:4$
$x=y-2$ $|+2$
$\color{green}{y=x+2}$
$y-6=-x$ $|:+6$
$\color{blue}{y=-x+6}$ -
Draw the lines in a coordinate system
$\color{green}{f(x)=x+2}$
$\color{blue}{g(x)=-x+6}$
-
Determine the intersection and specify the solution set
One intersection: $I(2|4)$
=> There is one solution
$S=\{(2|4)\}$
