Graph of a function
Functions can be graphically displayed in a coordinate system just like relations.
Each pair of numbers belonging to the function determines a point in the coordinate system. The set of all points is called the graph of a function.
Remember
Example
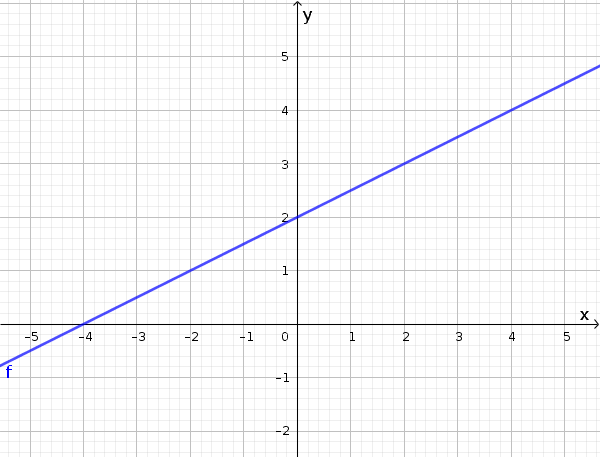
Given is the following function $f(x)=\frac12x+2$.
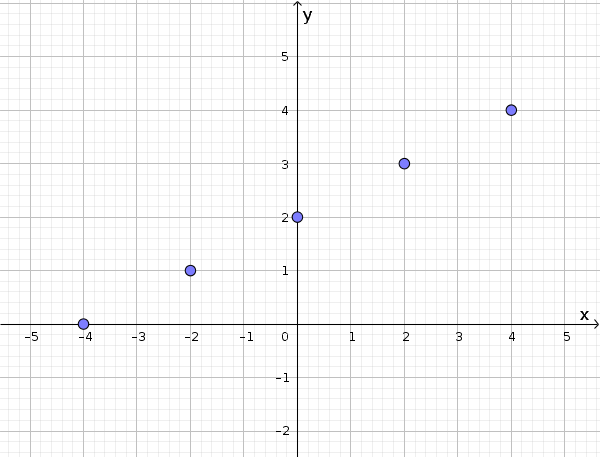
If the domain is $D=\{-4,-2,0,2,4\}$, then the graph only consists of five points $(-4|0)$, $(-2|1)$, $(0|2)$, $(2|3)$ and $(4|4)$.
If the domain includes all rational numbers $D=\mathbb{Q}$, then the graph has an infinite amount of ordered pairs and thus forms a line:
Hint
Recognizing a graph of a function
A function is a clear allocation of points, so each x-value is assigned to exactly one y-value.
How can it be recognized whether a graph is a graph of a function or not?
Remember
Example
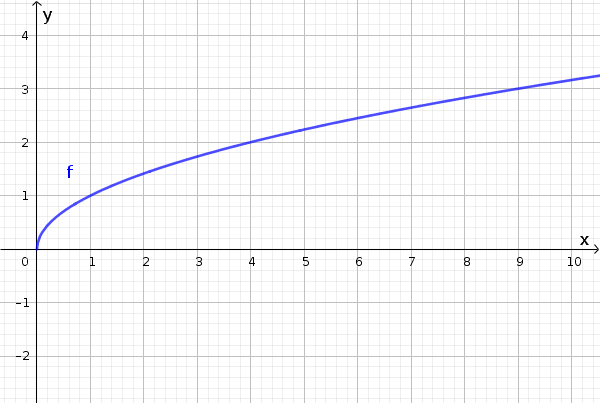
A valid graph of a function would be:
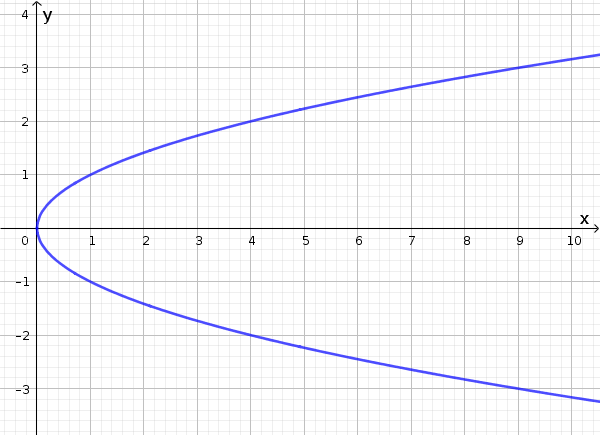
The following example is not a graph of a function, because the x-values are assigned to two y-values.